The following case study vignettes provide a demonstration of our thinking and a reflection of the scope of our services. In the spirit of protecting the confidential nature of this work, we have kept client names and sometimes their industry anonymous. If you have any questions or would like further information about any of these case study vignettes or case studies from other industries/situations, please let us know.
Vignette #1:
The Little Ads That Could
A major global industrial supplier of safety/protection equipment to various industries was facing financial pressures with one of its major product groups – the worldwide oil and gas market. While it was business as usual for its other product groups in terms of advertising, using traditional trade publications, online banners, and e-newsletter sponsorships, this product group couldn’t afford to invest in advertising until more favorable market conditions returned. However, it wanted to get its many white papers and product videos in front of engineers and purchasing decision-makers throughout the world
 For a minimum initial investment of less than $1,500, SJ Insights recommended to this team the use of LinkedIn ads. This audience group has a high use of LinkedIn, and most belonged to some type of LinkedIn Group – from association member groups to vertical groups such as offshore drilling. Small text ads were used (with limited characters of 25 for headlines, and 75 for the description) along with a small image (just 50×50 pixels) and targeted to potential customers via desktop pages. Specific countries, titles, company size and business sectors were targeted, using a variety of ads that tested different images, headlines and offers (a link took the engineer to a page on the client’s website to download a free white paper or to view a product video).

(Note: shown for purposes of demonstrating size and image and copy limitations; actual ad included client’s name in headline.)
The program was highly successful. These powerful little ads attracted the attention of engineers with the tiny relevant images like the one featuring an oil platform in the North Sea (above left) or an oil rig (right). The click-through-rate was 15X higher than the average LinkedIn text ad, and leads were captured as prospects clicked through to the website to download the white paper. A variety of metrics were captured with a monthly dashboard report issued to review progress, including the number of white paper downloads, video views and leads generated. The program continued with increased spend, but still a fraction of what had been spent in the past. And good news spreads fast – other product groups got word of the program’s success and were anxiously raising their hand to do a similar program.
Vignette #2:
Predictive Modeling Hits The Mark
A major Fortune 500 company was spinning off its oldest division, and this division needed to change its name, establish a new progressive brand, while launching new services in diverse markets across the U.S. On top of that, the competitive environment was very aggressive and quite complex, varying by market and the types of products offered. In addition, the company marketed to both consumer and business segments. It was imperative that awareness of the new brand and brand positioning be established quickly, not only to help retain current customers from migrating to a competitor, but also to build recall of the launch messaging with non-customers.
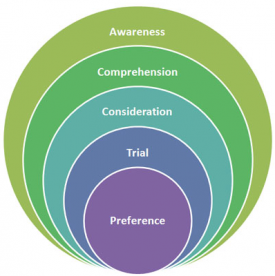
Brand Metric Stages – it all begins with awareness.
While levels of awareness and unaided awareness can easily be predicted for new products and services, with the complexity of the spin-off, the competition, the geographic markets, the customer type and more, setting outcome goals for awareness levels became a challenge. However to help set these goals (which were a key driver in establishing a launch budget), a predictive modeling analysis based on new product models was developed, which took into account a variety of factors including previous levels of awareness, anticipated competitive reaction scenarios, impact of messaging, advertising weight levels, type of mass media utilized, and other marcom launch activity (PR, direct, digital).
In this instance, the client’s own independent market research vendor tracked the results, and by the time frame designated, all goals had been achieved by audience and market type. In some instances, the predictive modeling analysis yielded results that were dead-on, and for others, results were extremely close, within +/- 3% of the goal.
Vignette #3
Social Media Usage Studies Showcase Opportunities
We all know the popularity of cat videos on YouTube, and cat celebrity memes such as Grumpy Cat and Sockington have become cottage industries, with personal appearances, cat food endorsements, books, t-shirts, Facebook accounts and more all becoming part of their personas. Psychologists and bloggers do research and write about why cats are so popular and why images of dogs are much, much rarer, and are certainly not as widely celebrated. The few well-known dog memes portray the dog as a ridiculous character, often the victim of the cat.
 Regardless if one is a cat or dog lover, both use the internet to share pictures and happenings of their beloved pets, especially via social media. In fact, many dogs and cats, like the popular feline memes mentioned above, have their own Twitter and Facebook accounts. A couple of years ago, as this pop culture trend was just beginning, Sheree Johnson wondered, with so many pet owners using the internet and other electronic devices, were veterinarians taking advantage of this opportunity?
As a result, The Veterinarian New Media Usage Study was conducted to provide comprehensive insight on the use of mobile and social media among veterinarians for business and personal purposes. This eye-opening research showed that both companion and large animal veterinarians had started using a number of new tools to communicate with their customers and staff. The study documented usage levels by site and device, frequency of use and attitudes about usage in their veterinarian practice. To put context to this research, the custom study also included insights about the social media activities of dog and cat owners compared to U.S. adults. (Both dog and cat owners are above average in using social media sites every day, and not surprisingly given the popularity of cats on the internet, cat owners are twice as likely as dog owners to use social media networking sites every day.)
The omnibus research served to help the animal health and nutrition company subscribers understand the emerging social media and text messaging trends and opportunities. Key highlights from the study were widely reported on in both consumer and business periodicals and websites. In addition to this social media usage study targeting veterinarians, Sheree Johnson has also conducted similar omnibus research for other professions such as farmers, physicians and nurses.
Vignette #4:
Robust Audience Segmentation Delivers More Bang for the “Bank”
We have numerous examples of audience segmentation development and the importance of defining robust target segments or personas versus just using typical demographic descriptors. For a major regional bank, a complete picture was painted through use of syndicated research of users by their lifestyles, demographic drivers, product usage and purchases, media consumption habits, number and type of financial accounts, credit capacity, investment approach, buying styles, attitudes and more. Based on this analysis, a handful of key target segments were identified for each key product (checking, home mortgage, etc.).
 Along with their profiles, these segments were given names and handles, e.g, Robert – “Fearless Investor,” or Patty – “Single Mom Saver.” This allowed for highly relevant messaging in terms of development and execution of advertising and digital campaign elements. In addition, the segments were also prioritized by branch location based on overlaying a variety of geographic data – providing insight for each branch in order to help customize in-branch communications.
This development and prioritization of audience segments helped the bank be more targeted, relevant and consequently more cost effective in marketing its various products and services.


